Purpose
I put together this survey to better understand the attitudes of the Star Wars fandom. I greatly enjoyed the two sequel-trilogy movies so far (The Force Awakens, The Last Jedi), and I’m surprised by how divisive the films have been, so I wanted to survey fans of the movies to understand this controversy. After forty years, Star Wars is a mature cultural product, and different aspects of it appeal (or do not appeal) to different people. I designed this survey to look at the diversity of the fandom’s attitudes at this moment in 2019 while we all wait for the release of The Rise of Skywalker in December.
This is Part 1 of the survey results. This is the long, boring part where I discuss the necessary details of how I did the survey, who took it, and how we know we can trust the survey’s results. Parts 2 and beyond will investigate more substantive questions.
In the survey, I promised anonymity to the respondents, so this is a project where I will not be sharing the raw data. I won’t touch on every statistical detail so that the report is more reader-friendly (but I will touch on some things, like statistical significance). If you have any questions about the methods, results, analyses, or anything else, please feel free to e-mail sw.survey.2019@gmail.com.
Sampling Method
I recruited fans by “snowball” sampling, which is a type of convenience sample. And while most academic research uses this sampling technique, it is less than ideal for obtaining a representative sample. But a representative sample wasn’t my intention here; instead, I wanted to get a cross-section of the Star Wars fandom, to understand how different types of fans responded to the films. I cold-emailed numerous fan websites, podcasts, authors, and so on, asking them to take and share the survey. After the first thousand responses came in, I worried about not getting enough women to take the survey (the count was under fifty at this point). I ran this study simultaneously on Amazon’s Mechanical Turk website, where I asked 300 Star Wars fans to respond. I used TurkPrime.com to only recruit women. This is why Claudia Gray’s tweet sharing my survey said I was looking for women in particular. This led to 5,330 responses over the course of four days.
Using this survey method has important limitations. Since it isn’t sampled in a representative way, I cannot speak to how accurately estimates like “75% of people liked the movie” are to the Star Wars fandom as a whole. It means there are unobserved dependencies in the data (e.g., two friends taking the survey are likely to have similar answers), which can create trouble when trying to estimate uncertainty. Because of this, I will be more conservative in how I interpret uncertainty, and I’ll assume there is probably more uncertainty than what the math tells me.
What this method does allow us to do, though, is examine at the underlying structure and relationship between attitudes of a very specific—but heterogeneous—group of people. I can look at what psychological and political attitudes correlate with liking films and characters. I can get an idea of how the fandom forms into clusters based on what movies they like. I can see how age, race, and gender relate to these analyses. All of these are found in subsequent parts of the survey results.
Thus, this is a survey of the Star Wars fandom. If you’re looking for information that is representative of the general public (or at least of all Americans who have seen a Star Wars movie), then Morning Consult and YouGov provide fabulous polling on favorite movies, characters, and demographic trends. The Motion Picture Association of America (MPAA) publishes yearly reports that include representative demographics of those who go to top-earning box office movies. When these works are relevant to my findings, I will discuss them alongside the results. I do not use this information to weight this survey, as the general audience is not my target population. My target population is the more committed Star Wars fandom, for which I do not have information to weight on.
Survey Questions
I studied the psychology of prejudice and politics in graduate school, and I chose survey questions based on my personal research interests as well as what I thought would be useful predictors of attitudes toward Star Wars films and characters.
Referral. I asked participants how they found the survey.
Movie Favorability. I asked respondents how they felt about each of the main Star Wars movies on a scale from 1 (very negatively) to 10 (very positively). I didn’t include the spinoff movies primarily to make the survey shorter. In most of these questionnaires, I chose only a few items. This is because I wanted the survey to be short enough so that people—and not just the most dedicated people—would actually take it.
Character Favorability. On the same 1-to-10 scale, I asked participants how they felt about various major characters, which I limited to the movies I asked about. This is why beloved characters like Ahsoka Tano were not included. (Apologies to the many who wrote me wishing she were in this survey.)
Fandom Information. To better understand the type of fan responding, I asked people to rate themselves on a fan-rating scale from 1 (casual) to 10 (fanatic). I included a checklist of Star Wars activities: cosplay, reading the novels, attending meetups, and so on. Lastly, I asked how much respondents cared about what (a) other fans and (b) professional critics thought about the films.
Episode IX Excitement. I first asked respondents how excited they are for The Rise of Skywalker on a scale from 1 (not excited at all) to 10 (very much excited). On the next page, I remarked that George Lucas was consulted during the scriptwriting of Episode IX, and I asked the same question again.
Big 5. I asked participants to rate themselves on dimensions like how extroverted and anxious they saw themselves to be. This measures what psychologists call the “Big 5” personality traits, and it is one of the most reliable ways to measure personality. I used a ten-item scale to measure these personality traits (Gosling, Rentfrom, & Swann Jr., 2003).
Nostalgia. For many, Star Wars is intimately tied to nostalgia, so I asked people how nostalgic they were for various aspects of their past (friends, family, music, etc.). I used a shortened version of Batcho’s (1995) nostalgia scale to do this.
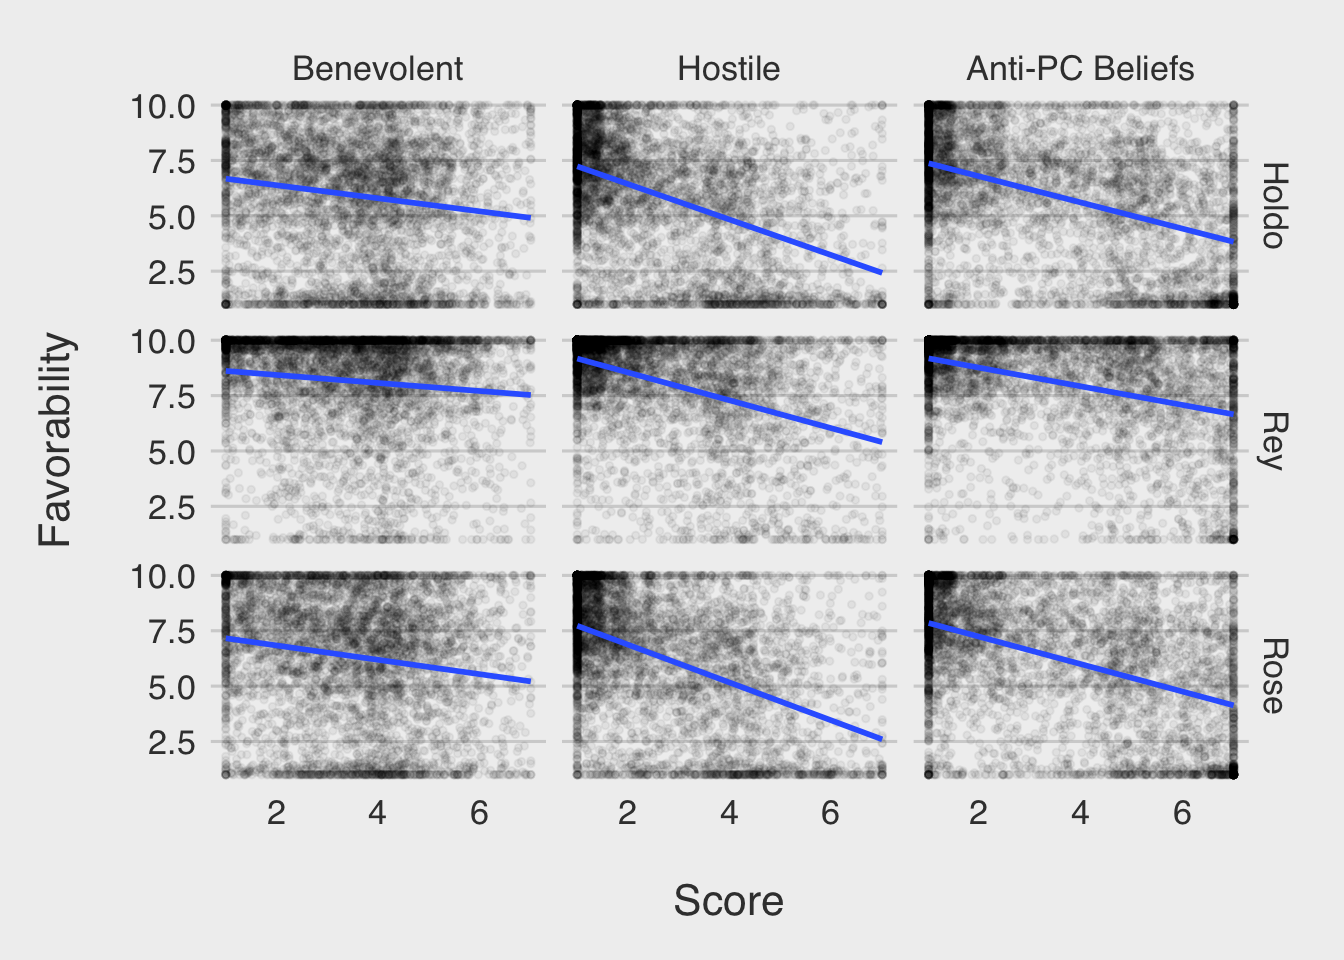
Ambivalent Sexism Inventory. These questions caused the most reaction. Social psychologists Glick and Fiske (1996) published a scale measuring two related types of sexism. The first is called “hostile sexism,” which captures the more traditional idea of what we think of as being “sexism”—i.e., that women are inferior to men, that gender relations are naturally antagonistic, etc. The second is called “benevolent sexism,” which captures a sneakier and seemingly positive form of sexism. For example, these are beliefs that women are pure and that men need to protect them. While these beliefs seem positive, researchers have shown in the two decades since Glick and Fiske’s original work that these beliefs can have negative effects for women. For brevity, I chose two items from each of the subscales. I measured sexism because part of the negative reaction to the sequel trilogy includes sexist rhetoric. The goal here is to study an empirical relationship between different types of sexism and attitudes toward Star Wars films and characters.
Political Correctness. A related criticism is that Disney has been preoccupied with “political correctness” in the sequel trilogy. This is a vague concept, but it can help predict attitudes. I asked how much respondents thought that “PC” culture was interfering with a free exchange of ideas. This item was taken from Lalonde, Doan, & Patterson (2000).
Tradition. The sequel trilogy has broken with some traditional aspects of Star Wars. George Lucas is no longer making the movies, and the young, optimistic hero of the original trilogy—Luke Skywalker—was depicted in the sequel trilogy as an old man exiling himself for mistakes he’d made. I selected four items that measure how much respondents prefer the status quo and tradition from McClosky (1958).
Empathy. Two items from the “fantasy” subscale of an empathy questionnaire published by Davis (1980) were included to assess how much respondents might empathize with characters from the films.
Movie Importances. Different people want different experiences from movies. Star Wars fans are a diverse group that often wants the movies to make conflicting narrative or stylistic choices. A single movie cannot please the entire fandom. I wrote a scale assessing how important varying experiences might when watching a movie, such as having fun, being emotionally moved, etc., to get an idea of what Star Wars fans want from movies as well as how these wants relate to favorabiltiy toward episodes and characters.
Demographics. Lastly, I asked standard, demographic questions of age (year born), gender, education, race, and political affiliation. Aside from political affiliation (which was a seven-point scale), I left all these as open-response items (i.e., people could freely write whatever they wanted). I did this to (a) give people the freedom to identify how they identify, and (b) help weed out troll respondents, as trolls will generally write something that gives them away as antagonistic respondents. I asked participants how old they were when they first saw a Star Wars movie.
I asked participants at the end of the survey if they had any other thoughts they’d like to share, or if they’d like to provide their email so that they can be sent the results.
Handling Trolls
I ran this survey by myself, as a hobby, with no organizational or professional affiliations. Not wanting to spend much of my own money on a side project, I opted for snowball sampling instead of using an expensive panel. I knew that if this survey were to be spread widely, then there would be risk of troll responding (i.e., antagonistic respondents trying to influence and harm the validity of the survey’s results).
Removing trolls was a two-step process. First, I read through and manually coded all the gender, education, race, and referral questions; these are questions that the survey-takers were asked about themselves, i.e. their gender, race, etc. I read every thought shared at the end of the survey. I flagged responses that felt troll-ish to me, and any case with one flag was removed. Some examples of what felt troll-ish to me:
Race: “whitey,” “white like chalk,” “Lando” (person also identified gender as “Lando”), “Jawa” (also identified gender as “R2D2” and education as “X-Wing Fighter”)
Education: “your mom goes to college,” “your mom taught me everything I need to know,” “Uzbekistani National diploma in Kazakhaphobia”
Gender: “Pan generic bender fluid tomato, part chair,” “droid”
Referral: “By some SJW bitch,” “your mom,” “Zocdoc”
Shared thoughts: “gay,” “I had to fart twice during this quiz”
If I was unsure about flagging anything, I looked for other giveaways of troll responding, such as saying they were born in 1969, to verify that a respondent was trolling.
I want to make it clear that people were not removed for only saying offensive things in the “shared thoughts” section; many people did, and they appear in this survey sample. I removed people only if I thought their response indicated they were not responding to the items in a faithful matter.
Second, I ran a few clustering algorithms on people’s responses. People responding genuinely tend to respond in similar ways, so clustering algorithms were able to find outliers and small clusters of unusual answers (e.g., always responding with the same number, or responding in opposite ways to questions that measure the same thing). These cases were hand-checked, and most were removed. Anyone claiming a birthday before 1930 was removed, as was one person listing their birth year as 2019.
Final Sample
The sample started with 5,330 respondents. After cleaning the data, the total sample was 5,137.
Referrals
This table shows where most referrals came from. It includes any source that accounted for over 1% of the sample. The rest were collapsed into “Other, or too vague,” where “too vague” means the respondent said “internet” or “online.”
| Twitter, unspecified handle |
27 |
| JediTempleArchives.com |
17 |
| Reddit, unspecified subreddit |
10 |
| Claudia Gray |
9 |
| Didn’t specify |
7 |
| Other or too vague |
6 |
| MTurk |
6 |
| Direct referral |
6 |
| TheForce.net |
5 |
| Bryan Young |
3 |
| Facebook, unspecified page |
2 |
| StarWarsCantina subreddit |
2 |
I hope that this represents a decent cross-section of the fandom. I think fans of Claudia Gray’s novels, collectors that frequent JediTempleArchives.com, and Redditors on /r/StarWarsCantina represent decent varieties of the fandom. If you like this survey project, I highly recommend supporting JediTempleArchives.com, reading Claudia Gray’s books, listening to TheForce.net’s podcasts, and checking out Bryan Young’s projects, such as the Full of Sith podcast. I could not have collected so much data without their help.
Demographics
Age
The average birth year was 1984, and the median was 1985. Half of the sample was born between 1976 and 1993, which means that 25% of the sample was born before 1976, while 25% was born after 1993. A wide range of fandom generations were captured here, from people who were adults when A New Hope was released to those who were babies when The Phantom Menace was released.
Gender
36% of the sample identified as a woman, 60% as a man, and 2% as non-binary or transgender. 1% did not respond to the question.
How does this compare against probabilistic samples designed to be representative? The 2015 MPAA Theatrical Market Statistics report estimates that 58% of people who saw The Force Awakens in the first two weeks were men, and 42% being women. The 2016 report estimates 59% men and 41% women for Rogue One, and the 2017 report has The Last Jedi at 60% men, 40% women.
It is important to note, however, that these estimates only consider viewers in the United States. The current survey did get some international respondents, though I failed to ask in what country people resided, so it is unclear precisely how many respondents were located outside the United States.
It is unclear if the lower percentage of women in the current sample is due to (a) the nature of the sampling method, or (b) the fandom’s most dedicated group containing more men.
Men in the current fandom sample, however, do self-report as more “fanatical” than respondents identifying as women, non-binary, or transgender. When I show results, I collapse non-binary and transgender respondents solely because only 10 people identified as transgender.
Race
|
Race
|
% of Sample
|
|
Asian or Pacific Islander
|
4
|
|
Black or African-American
|
2
|
|
Latinx
|
7
|
|
Multiracial
|
3
|
|
White
|
78
|
|
Didn’t respond
|
6
|
The sample was less racially-diverse than the data reported by the aformentioned MPAA reports. The racial compositions they estimated for theater-goers in the first two weeks after a release were:
|
Film
|
AAPI
|
Black
|
Latinx
|
White
|
Other
|
|
TFA
|
7%
|
12%
|
15%
|
61%
|
5%
|
|
RO
|
8%
|
11%
|
15%
|
62%
|
4%
|
|
TLJ
|
9%
|
11%
|
18%
|
57%
|
4%
|
Like gender above, this difference between the current sample and representative ones could be due to (a) the nature of the sampling method, or (b) the fandom’s most dedicated group containing more White people. But unlike gender above, non-White respondents say they are just as “fanatical” as White fans. I collapsed across all non-White respondents to produce a bigger sample size for this estimate.
Education
|
Education
|
% of Sample
|
|
Advanced degree (e.g., MA, PhD, MD)
|
20
|
|
College degree (e.g., BA, BS)
|
51
|
|
Less than college degree
|
27
|
|
Didn’t responsd
|
3
|
Political Attitudes

1% did not answer this question.
Self-Reported Fandom

1% did not answer this question.
Fan Activities
|
Star Wars Activity
|
% of Sample
|
|
Follow news
|
90
|
|
Have collectibles
|
79
|
|
Watch cartoons
|
77
|
|
Read novels
|
73
|
|
Play video games
|
69
|
|
Read comics
|
58
|
|
Listen to podcasts
|
42
|
|
Play board games
|
31
|
|
Attend conventions
|
27
|
|
Make art
|
21
|
|
Cosplay
|
19
|
|
Write fan fiction
|
18
|
|
Go to meetups
|
13
|
The self-reported fandom and activity questions further support that dedicated fans were sampled.
Scale Validation and Sanity Checks
Even after removing troll respondents, I wanted to ensure that these data make sense. This section contains “obvious” and/or established findings. I wanted to replicate them here so that we know the data are telling us what we know they should be telling us. To get technical for a second: I performed confirmatory factor analyses on scales, and I compared correlation matrices of MTurk and non-MTurk recruited individuals. When I use these scales in the future, I will include these details in technical appendices. But for now, know that the correlations made sense. I highlight a few here.
We know that people who like a Star Wars episode probably also like a movie from that same trilogy. What I show below is a correlation plot of how much people liked each Star Wars movie. In all of the following parts of the survey results, I will refer to the Star Wars episodes by the abbreviations of their names: The Phantom Menace is TPM, A New Hope is ANH, etc.
Larger, bluer circles mean the correlations are more positive; larger, redder circles mean the correlations are more negative. Small, faint circles mean that the correlations are closer to zero, which means that attitudes toward the movies are unrelated to one another. A big “X” over the box means that the correlation was not significant at p < .01.
We can see what we expect: Movies within the same trilogy tend to correlate with one another. Interesting to note is that Return of the Jedi correlates better with the prequels than the other original two movies. We see small, negative correlations between attitudes toward The Last Jedi and the original trilogy.

We see that conservatism is correlated to hostile (r = 0.66) and benevolent (r = 0.39) sexism; women score lower in each than men, which is consistent with previous research (Christopher & Mull, 2006; Glick & Fiske, 1996).

Every pattern incorporates some of the most sensitive items in the survey, and we observe relationships that are well-established in the literature. This leads me to believe that, despite the unusual snowball sampling methodology, the results I will present are valid.
Attitudes Toward Movies
Lastly, we can look at how the overall sample feels toward each of the movies. “Mn.” represents the mean score, “Mdn.” the median, and “Var.” the variance. This last measure, the variance, tells us how much people varied in their responses. “The Last Jedi” had by far the highest. This shows how much opinions strongly differ on the film. In future parts, I will be looking into these varied opinions toward “The Last Jedi” as well as the other films.